Maven Slopes Challenge
Full challenge details - Introducing the Maven Slopes Challenge.
Link to GitHub repository, including data and final output. Download a copy at the bottom right corner above.
1. Project Title and Description
A tool to help skiers find their ideal destination. It will look at the inputs of the user and recommend resort(s) that match the requirements.
2. Problem
There are many ski resorts around the world with different features and seasons. Casual and new skiers may find it hard to pick a destination that suits their needs. Hence, I build an interactive tool to address this problem.
3. Data
This dataset contains 2 tables in CSV format:
The Resorts table contains information on 499 ski resorts around the world, including their location, slopes, lifts, prices, and ski season.
The Snow table contains supplemental data on the surface of the earth covered by snow for each month in 2022, by latitude & longitude.
Data cleaning:
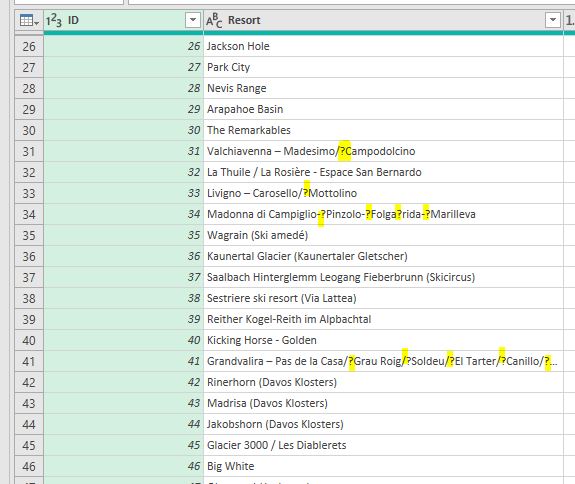
1. There are random question marks in the resorts’ names => remove and replace with nothing.
BEFORE
REPLACE CHARACTERS WITH NUMBERS
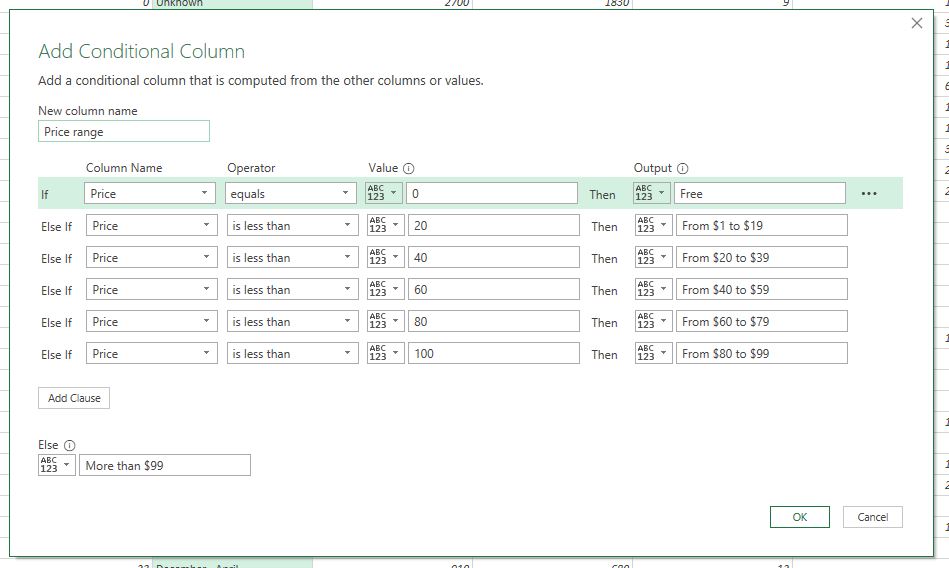
GROUP PRICES INTO RANGES
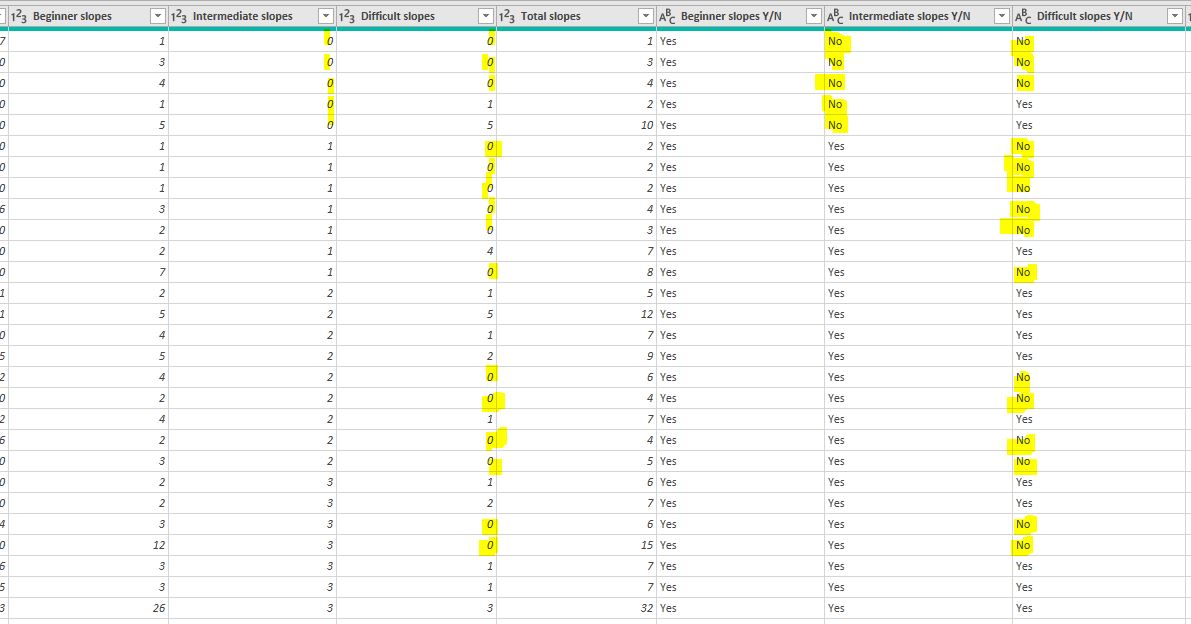
ADD YES/NO COLUMNS
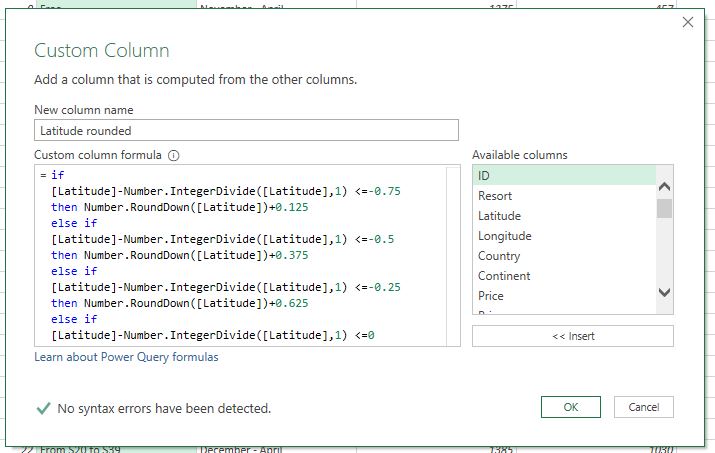
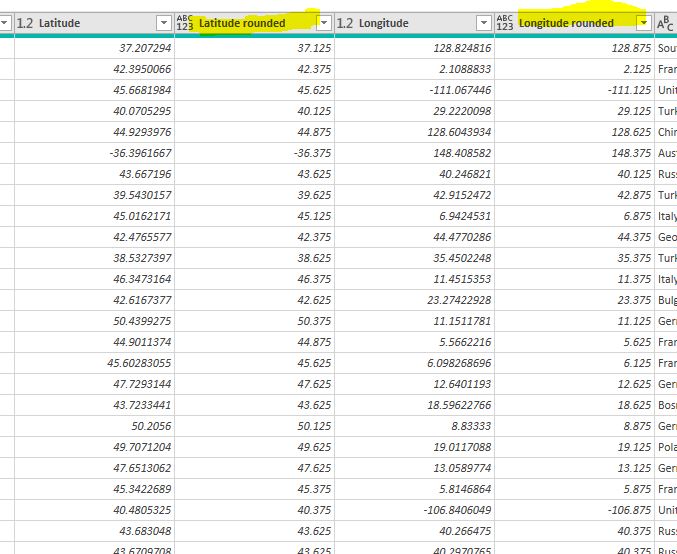
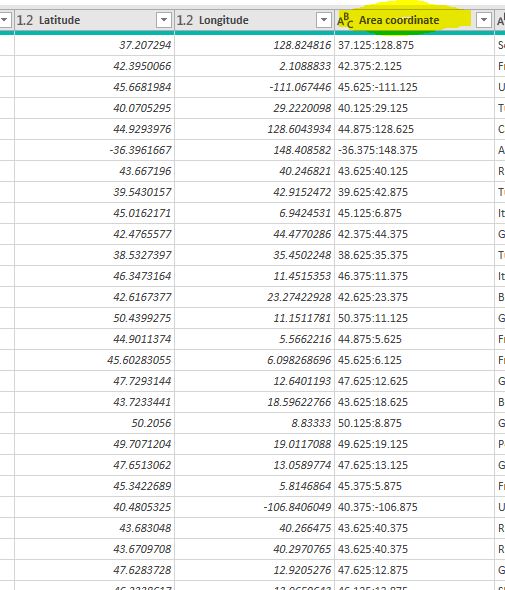
ROUNDING LATITUDE AND LONGITUDE
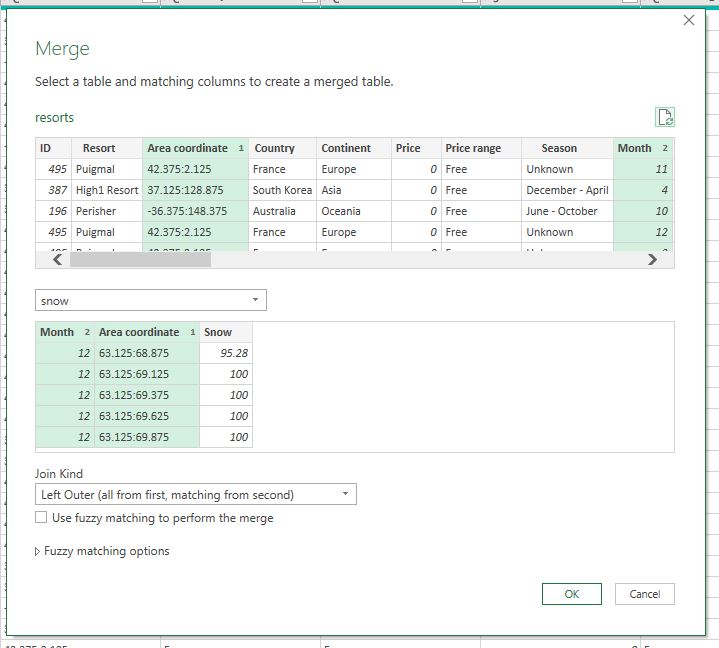
A pivot table that shows the list of resorts, the snow coverage, the number of snow cannons and the total lift capacity per hour. Snow coverage is used to rank the resorts, from highest coverage to lowest coverage. Snow cannons act as a backup plan in case of low snowfall. The higher the lift capacity, the faster speed of moving to the starting points, and the more skiing time.
The columns Month, Continent, Country, Price, Beginner slopes, Intermediate slopes, Difficult slopes, Summer skiing, Night skiing, Snowpark, and Child friendly are used as slicers for users to narrow down the resort list.
5. Technical Details
The project used entirely Excel to encourage beginners in data analysis to participate in the challenge. The data cleaning process was done in the Power Query editor of Excel. It is possible to clean the data using entirely Excel formulas instead of Power Query but the process would be more tedious.
6. Challenges
In the beginning, I made the mistake of creating several filter tables for the months, area, and snow coverage. It was not possible because the data model became too complex and the relationships did not filter through correctly. I realised that it was much easier to bring all the data I needed into the Resorts tables.
The area coordinates follow a specific format with an increment of 0.25 starting from -0.875. It took some time to write the correct M code to round the coordinates in the Resorts table to the nearest region.
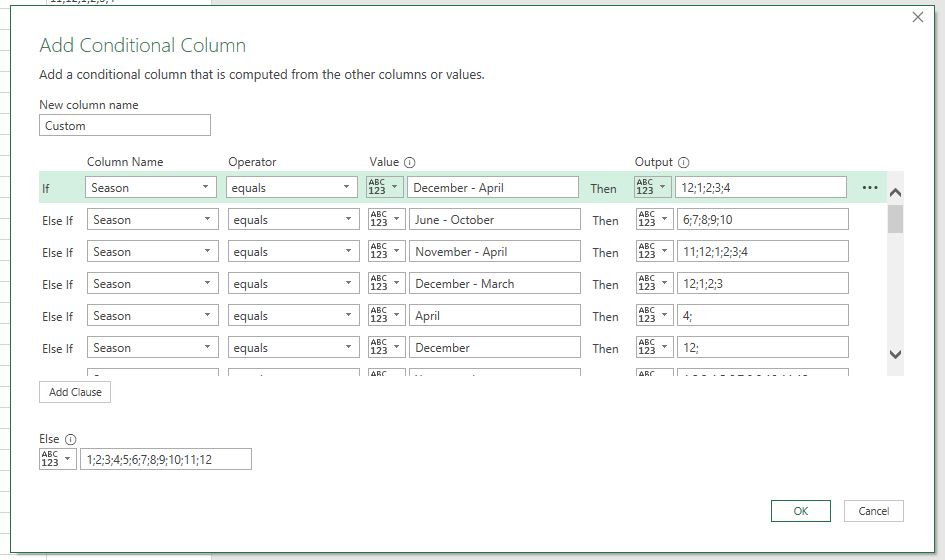
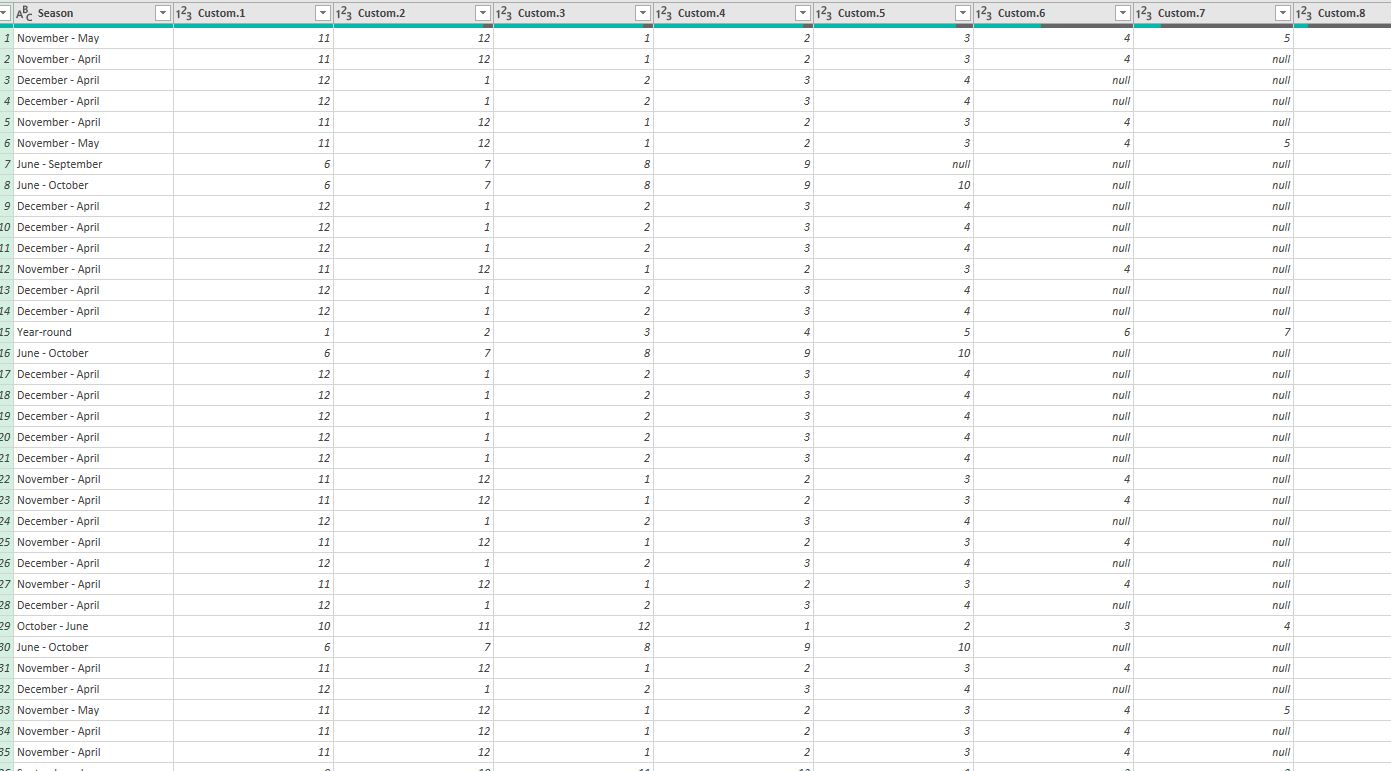
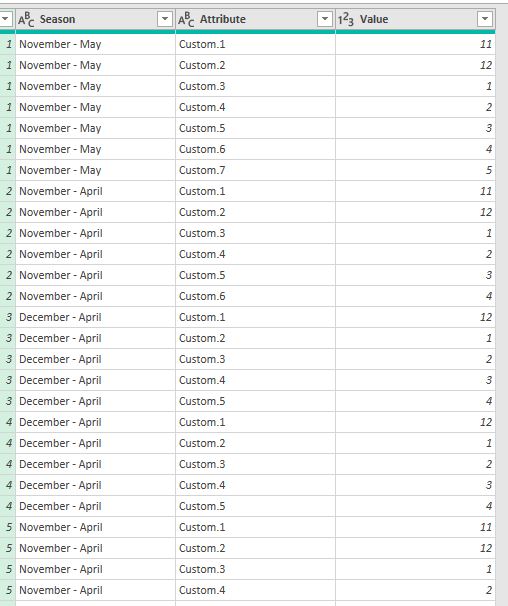
The season column in the Resorts table took a while to be transformed into months. I could not write an M code to automatically transform the values. Hence, I used the manual approach to match the seasons with the associated months with the ‘Column from example’ function.